Gráfico de Pirámide de Población con Barras Apiladas Divergentes
Capacidades del Visual en Deneb
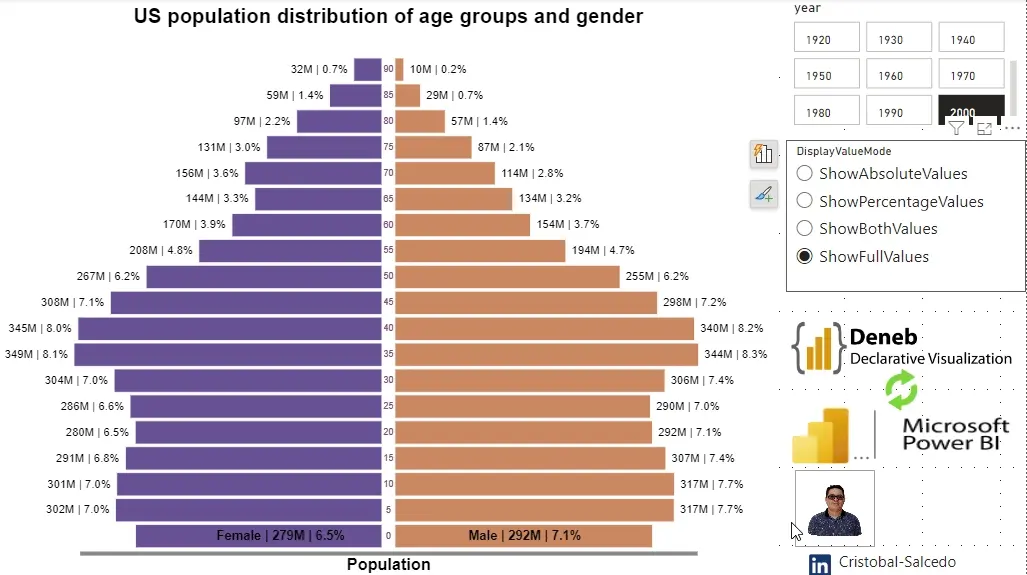
Este visual en Power BI, desarrollado con Deneb y Vega-Lite, ofrece un análisis detallado de la distribución poblacional por género y edad. Entre sus principales características se incluyen:
- Etiquetas Dinámicas: Muestra información flexible (población total o porcentaje) adaptada a distintos modos de visualización.
- Cálculo y Formato Dinámico: Uso de la función
pbiFormatpara formatear porcentajes y cifras con precisión, adaptándose al tamaño de los datos. - Visualización en Capas: Combina barras apiladas, etiquetas y títulos personalizados, optimizando la presentación de la información.
- Configuración Avanzada de Estilos: Personaliza colores, alineación y opacidad de los elementos según los datos mostrados.
Este visual proporciona una representación clara y dinámica de los datos demográficos, mejorando la comprensión y presentación en Power BI.
Descarga los archivos utilizados aquí👇
🔽 Diverging_Stacked_Bar_Chart_Population_Pyramid.pbix (2.69 MB)
🔽 Diverging_Stacked_Bar_Chart_Population_Pyramid.json: ( 8.82 KB)
Referencias y recursos adicionales:
- Deneb Official Website: Recursos y documentación oficial de Deneb.
- Opciones avanzadas para la función pbiFormat: Guía sobre el uso avanzado de
pbiFormat. - Formateo en Deneb: Recurso completo sobre las técnicas de formateo en Deneb.
- Gráfico de barras apiladas divergentes (pirámide de población): Ejemplo práctico de un gráfico de pirámide de población utilizando Vega-Lite.
Copy the Template Below👇✔
{
  "$schema": "https://vega.github.io/schema/vega-lite/v5.json",
  "usermeta": {
    "information": {
      "uuid": "3ecd6e60-2b7c-484a-a05d-ae0f7a47870c",
      "generated": "2024-09-26T03:38:37.159Z",
      "previewImageBase64PNG": "data:image/png;base64,iVBORw0KGgoAAAANSUhEUgAAAAEAAAABCAQAAAC1HAwCAAAAC0lEQVR42mNkYAAAAAYAAjCB0C8AAAAASUVORK5CYII=",
      "name": "Diverging Stacked Bar Chart (Population Pyramid)",
      "description": "Diverging Stacked Bar Chart (Population Pyramid): Based on an official Vega-Lite example and adapted for use in Deneb within Power BI. Note: Cross-filtering interactivity is limited when using 'aggregate'. Author: Cristobal Salcedo Beltran. Contact: csalcedo90@gmail.com.",
      "author": "Cristobal Salcedo Beltran"
    },
    "deneb": {
      "build": "1.7.1.0",
      "metaVersion": 1,
      "provider": "vegaLite",
      "providerVersion": "5.20.1"
    },
    "interactivity": {
      "tooltip": true,
      "contextMenu": true,
      "selection": false,
      "selectionMode": "simple",
      "highlight": false,
      "dataPointLimit": 50
    },
    "config": "{\r\n  \"background\": \"transparent\",\r\n  \"view\": {\r\n    \"stroke\": \"transparent\"\r\n  },\r\n  \"axisX\": {\r\n    \"labels\": false,\r\n    \"ticks\": false,\r\n    \"titleFontSize\": 20,\r\n    \"offset\": 5,\r\n    \"domainWidth\": 5\r\n  },\r\n  // Legend configuration\r\n  \"legend\": {\r\n    \"title\": \"\", // No title for the legend\r\n    \"orient\": \"top\",\r\n    \"symbolSize\": {\r\n      \"expr\": \"DisplayValueMode==4?0:280\"\r\n    }, // Size of the symbols in the legend\r\n    \"disable\": false, // Ensure legend is enabled\r\n    \"labelFontSize\": 14, // Font size of legend labels\r\n    \"labelFontWeight\": \"bold\", // Bold font for legend labels\r\n    \"columnPadding\": 10, // Padding between legend columns\r\n    \"labelColor\": {\r\n      \"expr\": \"DisplayValueMode==4? 'transparent': datum.label == 'Male' ?  '#ca8861':'#675193' \" // Conditional color for labels\r\n    },\r\n    \"labelAlign\": \"left\" // Align legend text to the left of the symbol\r\n  }\r\n}",
    "dataset": [
      {
        "key": "__4__",
        "name": "year",
        "description": "",
        "kind": "column",
        "type": "numeric"
      },
      {
        "key": "__0__",
        "name": "sex",
        "description": "",
        "kind": "column",
        "type": "numeric"
      },
      {
        "key": "__1__",
        "name": "age",
        "description": "",
        "kind": "column",
        "type": "numeric"
      },
      {
        "key": "__2__",
        "name": "TotalPeople",
        "description": "",
        "kind": "measure",
        "type": "numeric"
      },
      {
        "key": "__3__",
        "name": "DisplayOptionsValue",
        "description": "",
        "kind": "measure",
        "type": "numeric"
      }
    ]
  },
  "description": "Diverging Stacked Bar Chart (Population Pyramid): Based on an official Vega-Lite example and adapted for use in Deneb within Power BI. Note: Cross-filtering interactivity is limited when using 'aggregate'. Author: Cristobal Salcedo Beltran. Contact: csalcedo90@gmail.com.",
  "data": {
    "name": "dataset"
  },
  "params": [
    {
      "name": "DisplayValueMode",
      "expr": "pluck(data('dataset'),'DisplayOptionsValue')[0]"
    }
  ],
  "transform": [
    {
      "calculate": "datum['__0__'] == 2 ? 'Female' : 'Male'",
      "as": "gender"
    },
    {
      "calculate": "datum['__0__'] == 2 ? -datum['__2__'] : datum['__2__']",
      "as": "signed_people"
    }
  ],
  "encoding": {
    "x": {
      "aggregate": "sum",
      "field": "signed_people",
      "title": "Population",
      "axis": {
        "format": "s"
      }
    },
    "y": {
      "field": "__1__",
      "axis": null,
      "sort": "descending"
    },
    "color": {
      "field": "gender",
      "scale": {
        "range": [
          "#675193",
          "#ca8861"
        ]
      },
      "legend": {
        "orient": "top",
        "title": null
      }
    }
  },
  "layer": [
    {
      "mark": {
        "type": "bar",
        "stroke": "#fff",
        "strokeWidth": 1,
        "xOffset": {
          "expr": "datum.gender=='Male'? 8: -8"
        }
      }
    },
    {
      "mark": {
        "type": "text"
      },
      "encoding": {
        "text": {
          "field": "__1__"
        },
        "x": {
          "aggregate": "count"
        },
        "y": {
          "field": "__1__"
        }
      }
    },
    {
      "transform": [
        {
          "window": [
            {
              "field": "signed_people",
              "op": "sum",
              "as": "TotalPopulationPerAgeGroup"
            }
          ],
          "frame": [
            null,
            null
          ],
          "groupby": [
            "__0__"
          ]
        },
        {
          "window": [
            {
              "field": "signed_people",
              "op": "sum",
              "as": "TotalPopulationPerGenderAge"
            }
          ],
          "frame": [
            null,
            null
          ],
          "groupby": [
            "gender",
            "__1__",
            "TotalPopulationPerAgeGroup",
            "__0__"
          ]
        },
        {
          "calculate": "pbiFormat(abs(datum.TotalPopulationPerGenderAge/datum.TotalPopulationPerAgeGroup),'0.0%')",
          "as": "percentageOfPopulation"
        },
        {
          "calculate": "pbiFormat(abs(datum.TotalPopulationPerGenderAge)/100000,'#0')",
          "as": "formattedTotalPopulation"
        },
        {
          "calculate": "pbiFormat(abs(datum.TotalPopulationPerGenderAge), '#,0', { value : if(abs(datum.TotalPopulationPerGenderAge) >= 1e12, 1e12, if(abs(datum.TotalPopulationPerGenderAge) >= 1e9, 1e9, if(abs(datum.TotalPopulationPerGenderAge) >= 1e6, 1e6, if(abs(datum.TotalPopulationPerGenderAge) >= 1e3, 1e3, 0 )))), precision: 0 })",
          "as": "formattedTotalPopulation"
        },
        {
          "calculate": "datum.gender + '_' + datum.formattedTotalPopulation +  ' | ' +  datum.percentageOfPopulation ",
          "as": "labelTextFirst"
        },
        {
          "calculate": "DisplayValueMode==4? (datum['__1__']==0?datum.gender + ' | ' + datum.formattedTotalPopulation +  ' | ' +  datum.percentageOfPopulation: datum.gender + '_' + datum.formattedTotalPopulation +  ' | ' +  datum.percentageOfPopulation ): datum.labelTextFirst",
          "as": "labelText"
        },
        {
          "calculate": "datum.signed_people/2",
          "as": "median_people"
        }
      ],
      "layer": [
        {
          "mark": {
            "type": "text",
            "fontSize": 14,
            "opacity": {
              "expr": "datum['__1__']==0 && DisplayValueMode==4?0:1"
            },
            "align": {
              "expr": "split(datum.labelText,'_')[0]==='Male'?'left':'right'"
            },
            "dx": {
              "expr": "split(datum.labelText,'_')[0]==='Male'?15:-15"
            }
          },
          "encoding": {
            "color": {
              "value": "black"
            },
            "text": {
              "value": {
                "expr": "DisplayValueMode==1? split(split(datum.labelText,'_')[1],'|')[0]: DisplayValueMode==2? split(datum.labelText,'|')[1]: DisplayValueMode==3? split(datum.labelText,'_')[1]: datum['__1__']=='0'? datum.labelText: split(datum.labelText,'_')[1]"
              }
            },
            "x": {
              "aggregate": "sum",
              "field": "signed_people",
              "type": "quantitative",
              "bandPosition": 0.5
            },
            "detail": {
              "field": "labelText"
            }
          }
        },
        {
          "mark": {
            "type": "text",
            "fontWeight": "bold",
            "fontSize": 16,
            "opacity": {
              "expr": "datum['__1__']==0 && DisplayValueMode==4?1:0"
            },
            "dx": {
              "expr": "split(datum.labelText,'_')[0]==='Male'?15:-60"
            },
            "align": {
              "expr": "split(datum.labelText,'|')[0]==='Male'?'right':'left'"
            }
          },
          "encoding": {
            "color": {
              "value": "black"
            },
            "text": {
              "value": {
                "expr": "datum['__1__']=='0'? datum.labelText: split(datum.labelText,'_')[1]"
              }
            },
            "x": {
              "aggregate": "sum",
              "field": "median_people",
              "type": "quantitative"
            },
            "detail": {
              "field": "labelText"
            }
          }
        }
      ]
    }
  ],
  "config": {
    "view": {
      "stroke": null
    },
    "axis": {
      "grid": false
    }
  },
  "title": {
    "text": "US population distribution of age groups and gender",
    "fontSize": 25,
    "fontWeight": "bold",
    "fontStyle": "arial"
  }
}
¿Te resultó útil este artículo?
Si este contenido te ha ayudado, considera apoyarme con un café. Tu apoyo me permite seguir creando contenido de calidad.