Interactive Responsive Bar Chart with Cross-Filtering Template
Download the files used here
🔽 Responsive_Bar_Chart_With_Cross_Filtering.pbix (1.84 MB)
🔽 Template_Responsive_Bar_Chart_With_Cross_Filtering.json: (2.63 KB)
Copy Template
{
"$schema": "https://vega.github.io/schema/vega-lite/v5.json",
"usermeta": {
"deneb": {
"build": "1.6.2.1",
"metaVersion": 1,
"provider": "vegaLite",
"providerVersion": "5.16.3"
},
"interactivity": {
"tooltip": true,
"contextMenu": true,
"selection": true,
"highlight": false,
"dataPointLimit": 50
},
"information": {
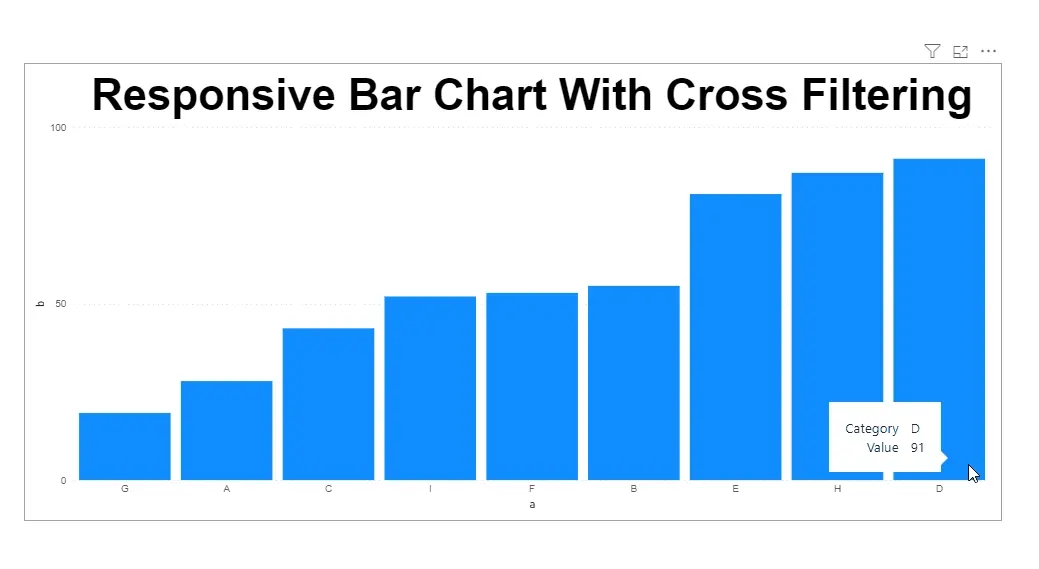
"name": "Responsive Bar Chart With Cross Filtering",
"description": "[No Description Provided]",
"author": "Cristobal Salcedo Beltran",
"uuid": "aa2d11a1-9a68-4555-b78d-fc4b77e70ffb",
"generated": "2024-06-12T03:20:41.339Z"
},
"dataset": [
{
"key": "__0__",
"name": "a",
"description": "Categories represented on the X-axis",
"type": "text",
"kind": "column"
},
{
"key": "__1__",
"name": "b",
"description": "Values represented on the Y-axis",
"type": "numeric",
"kind": "measure"
}
]
},
"config": {
"view": {"stroke": "transparent"},
"background": "transparent",
"title": {
"fontSize": {"expr": "width/21"}
},
"axis": {
"labelColor": "#605E5C",
"labelFontSize": 12,
"titleFontWeight": "normal"
},
"axisQuantitative": {
"tickCount": 3,
"grid": true,
"gridColor": "#C8C6C4",
"gridDash": [1, 5]
},
"axisX": {
"labelPadding": 5,
"labelAngle": 0
},
"axisY": {"labelPadding": 10},
"bar": {
"fill": {"expr": "pbiColor(0)"}
}
},
"description": "This responsive bar chart visualizes the quantitative values of '__1__' for each categorical variable '__0__'. It allows users to interact with the data through tooltips, context menus, and selection features, facilitating cross-filtering and detailed analysis. Author: Cristobal Salcedo Beltran, Email: csalcedo90@gmail.com",
"title": "Responsive Bar Chart With Cross Filtering",
"data": {"name": "dataset"},
"mark": "bar",
"encoding": {
"x": {
"field": "__0__",
"type": "nominal",
"sort": {
"field": "__1__",
"order": "ascending"
}
},
"y": {
"field": "__1__",
"type": "quantitative"
},
"tooltip": [
{
"field": "__0__",
"type": "nominal",
"title": "Category"
},
{
"field": "__1__",
"type": "quantitative",
"title": "Value"
}
],
"opacity": {
"condition": {
"test": {
"field": "__selected__",
"equal": "off"
},
"value": 0.3
},
"value": 1
}
}
}
¿Te resultó útil este artículo?
Si este contenido te ha ayudado, considera apoyarme con un café. Tu apoyo me permite seguir creando contenido de calidad.